Real Estate Information Archive

Blog

Displaying blog entries 1-7 of 7

The Best Time to Sell

by Christie Cannon

The Best Time to Sell: The Week of April 16-22

Article by: Hannah Jones | realtor.com


Home sellers on the fence waiting for that perfect moment to sell should start preparations, because the best time to list a home in 2023 is approaching quickly. 

The week of April 16-22 is expected to have the ideal balance of housing market conditions that favor home sellers, more so than any other week in the year.

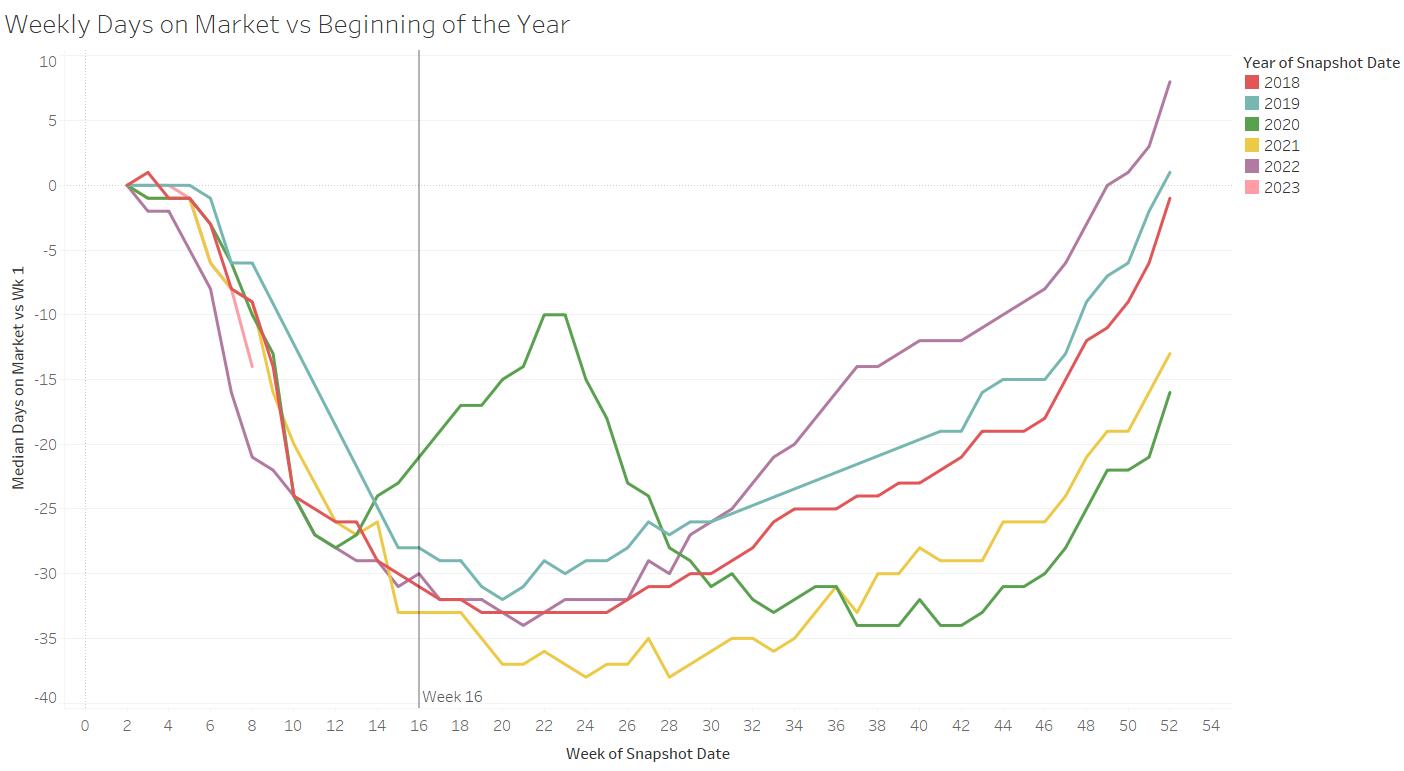
This selection comes from looking at seasonal trends from 2018-2019 and 2021-2022 data. Due to the onset of the pandemic, 2020 was an uncharacteristic year and has therefore been excluded from the analysis. We expect the 2023 housing market to behave similarly to 2021, 2022 and pre-pandemic years in terms of seasonality. Each week was scored based on favorability toward sellers — this included competition from other sellers (active listings and new listings), listing prices, market pace (days on market), likelihood of price reductions, and homebuyer demand (views per property on Realtor.com). Percentile levels for each week were calculated along each metric , and were then averaged together across metrics to determine a Best Time to List score for each week. Rankings for each week were based on these Best Time to List scores.

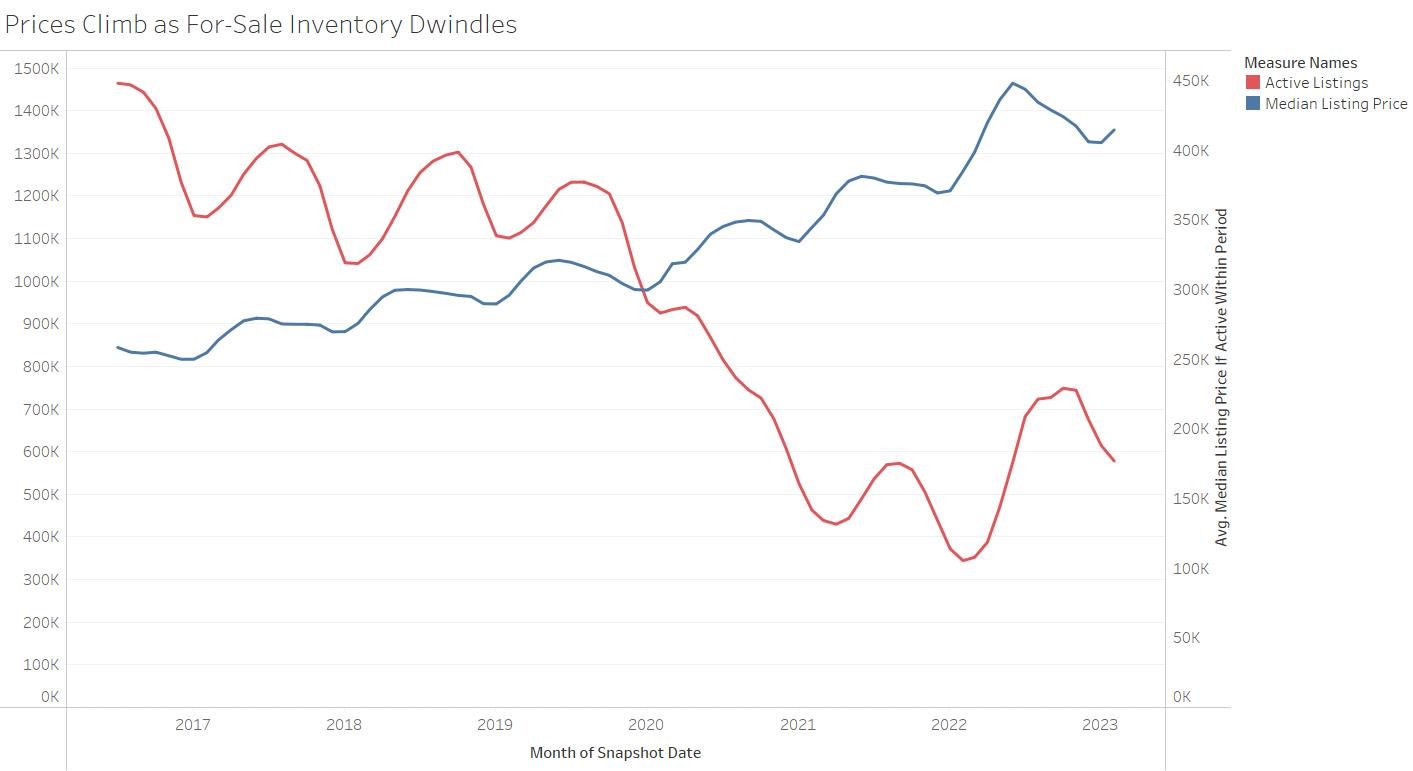
2022 was yet another remarkable year in housing, with prices reaching record high levels before the market cooled due to wide-spread unaffordability. Mortgage rates started climbing at the beginning of 2022, increasing the cost of financing a home purchase significantly as home price growth continued to accelerate compared to 2021. Home prices peaked at a median listing price of $449,000 nationally in June 2022, and price growth relative to the previous year continued through the end of the year. Red-hot buyer demand cooled around the home price peak as evidenced by fewer pending listings compared to the previous year, as well as homes spending an increased time on market. Though housing demand cooled in 2022 relative to the previous year, homes were still spending significantly less time on market than pre-pandemic, and inventory remained well below pre-pandemic norms. However, sellers responded to this market slowdown by pulling back significantly on new listings. Builders also responded by slowing the rate of single-family home construction starting in February. 

However, as 2022 concluded, mortgage rates fell slightly, enabling some buyers to re-engage with the housing market. Home sellers were less active in January 2023 compared to the previous year, but with home prices just 8.1% higher year-over-year–after a year of double-digit growth, and affordability slightly improved, the spring market could be advantageous for both buyers and sellers.

Benefits of Listing April 16-22, 2023

At a national level, this week represents a balanced selection of market conditions that favor sellers. While it does not have the highest price or the lowest time on market, this week offers higher than average prices and lower than average time on markets while also offering a higher than average number of buyers–measured as viewers per listing. While buyers vastly outnumbered sellers in recent years, we expect to see more balance between buyers and sellers in 2023. In more balanced housing market conditions, we expect the benefits of strategically listing during the most seasonally advantageous week to be greater.

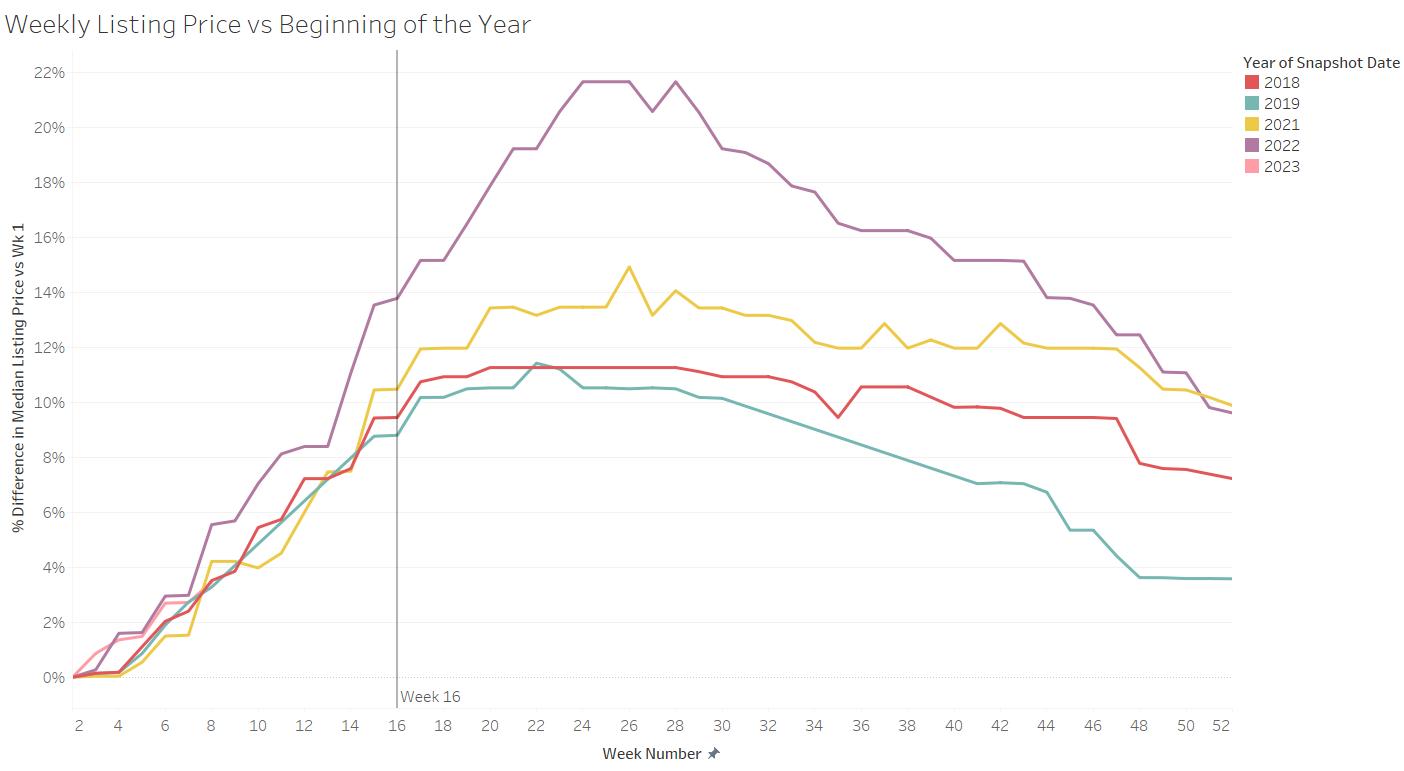
Above-average prices – Homes during this week have historically reached prices 2.1% higher than the average week throughout the year, and are typically 12.1% higher than the start of the year. If 2023 follows the typical seasonal trend, the national median listing price could reach $8,400 above the average week, and $48,000 more than the start of the year.

Above-average buyer demand – The number of buyers looking at a listing can determine how many offers a home gets and how quickly it sells. The more buyers looking at a home, the better for the seller, and in most years buyers start earlier than sellers. Historically, this week garnered 16.4% more views per listing than the typical week, but in 2022 this week got 32.5% more views per listing than the average week throughout the year due to the latter part of the year’s drop off in buyer demand and increase in homes for sale.

Fast market pace – Thanks to above-average demand, homes sell more quickly during this week. Historically, homes actively for sale during this week sold 18.0% faster than the average week. In the fast-moving 2022 market, this week saw homes typically on the market for 32 days, 13 days faster than the year’s average, and 37 days faster than was typical in 2019. The 2023 market is not expected to move as quickly as in 2022, but the best week is still expected to see a more rapid market pace than the year’s typical pace.

Lower competition from other sellers –  A typical inventory trend would mean 9.3% fewer sellers on the market during this week compared to the average week throughout the year. With few exceptions, the number of sellers tends to increase from the beginning of the year until roughly November. Last year saw more significant inventory gains after the first four months as buyer demand cooled, but sellers responded by pulling back on listings once again by the end of the year. Active inventory was 65.5% higher at the start of 2023 versus 2022, but still 43.2% lower than pre-pandemic levels. This gap means there continue to be opportunities for sellers who enter the market this spring.

Market Dynamics Shift – Pent-Up Buyer Demand

Last year, sellers enjoyed sustained demand until mortgage rates caught up to buyers, pushing many out of the market altogether. As a result, inventory climbed and price growth eventually slowed (though continued to be higher than in 2021). For-sale inventory is still well below pre-pandemic levels, so sellers can expect demand to return with force as affordability improves.

    • Mortgage rates are expected to remain elevated. Mortgage rates climbed from 3.2% at the beginning of 2022, to more than 7% in November before settling back to 6.42% by the end of the year and have stayed above 6% so far in 2023. We expect mortgage rates to remain elevated through 2023 as the Fed continues its tightening cycle to bring inflation down to 2%. Though the Fed has slowed the rate of rate increases, they continue to emphasize their intent to continue raising rates until the inflation target is in sight. This means that buyers will continue to see high borrowing costs, which may take away from their home budget.
    • Supply does not match up to demand. 2021 saw the highest rates of home construction in the last decade-plus. However, 2022 slowed this trend as builders saw buyer demand dwindle, worsening the home supply gap. Buyer demand has fallen due to increasing unaffordability. While this may limit asking prices, it can benefit sellers who are cashing in on their record-high home equity. Sellers who are also buyers may be able to be more flexible in closing both a sale and a purchase this year.
    • Prices tend to peak later, as does competition. Likewise, sellers should consider that peak prices later in the season also come with greater competition from other sellers for a similar-sized pool of buyers. Historically, by the end of June, while prices reached near-peak levels (+15.0%) compared to the start of the year, new sellers also surged, increasing to nearly 1.5 times higher than at the start of the year (+43.7%). More sellers mean more options for buyers and therefore more competition among sellersSellers can mitigate that risk by being an early entry into the market, raising their already high odds of a successful close and likely negotiating favorable terms.
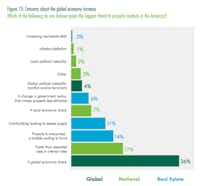
    • Strong Demand for Well-maintained, Fairly-Priced Homes – While overall buyer demand may not be what it was in the past couple of years, many sellers are still seeing competition for homes that are well-priced and move-in ready in prime locations. Buyers feeling the pressure of affordability will likely be choosier and less willing to shell out the big bucks for a less-than-ideal home.

What does this mean for sellers?

While we’ve identified April 16-22 as the best week to list for sellers, the housing market remains undersupplied, so a seller listing a well-priced, move-in ready home is likely to find success. Because spring is generally the high season for real estate activity and buyers are more plentiful earlier rather than later in the year, listing earlier in the spring raises a seller’s odds of a successful sale. Sellers will want to remember that it’s a process. In a recent survey we explored the steps sellers took to prepare their home for sale and how long it took them to get ready.

What does this mean for home buyers?

For buyers who have been facing still-high home prices, and elevated mortgage rates, there is a key takeaway: the usual seasonal dynamics of the housing market, builder sentiment, and seller sentiment suggest that it’s going to get better. Inventory improved in 2022, and continues to grow year-over-year, though lags pre-pandemic levels. However, so far in 2023, seller, builder and buyer sentiment have all improved, signaling that all parties involved are feeling a bit more optimistic about the housing market as we enter the spring. 

Historically, the number of views per listing has cooled in the late summer/early fall and tends to improve for buyers from that point forward. Additionally, by mid-August, the number of sellers with actively-listed homes increased 32% over the beginning of the year, which means more options for buyersThus, buyers who can persist in their home searches are likely to catch a bit of a break in the sense that they can expect some more options to choose from in the weeks ahead.

Interest Rates at Lowest in last 30 days

by Christie Cannon

Last week saw one of the largest mortgage interest rate drops in a single.  Acting on early indications that inflation cooled slightly in October & on the CPI report from the Bureau of Labor - interest rates dipped to their lowest level in the last 30 days. 

The Benefits of Homeownership May Reach Further Than You Think

by Christie Cannon

The Benefits of Homeownership May Reach Further Than You Think

The Benefits of Homeownership May Reach Further Than You Think | MyKCM
 

More than ever, our homes have become an integral part of our lives. Today they are much more than the houses we live in. They’re evolving into our workplaces, schools for our children, and safe havens that provide shelter, stability, and protection for our families through the evolving health crisis. Today, 65.3% of Americans are able to call their homes their own, a rate that has risen to its highest point in 8 years.

June is National Homeownership Month, and it’s a great time to reflect on the benefits of owning your own home. Below are some highlights and quotes recently shared by the National Association of Realtors (NAR). From non-financial to financial, and even including how owning a home benefits your local economy, these items may give you reason to think homeownership stretches well beyond a sound dollars and cents investment alone.

Non-Financial Benefits

Owning a home brings families a sense of happiness, satisfaction, and pride.

  • Pride of Ownership: It feels good to have a place that’s truly your own, especially since you can customize it to your liking. “The personal satisfaction and sense of accomplishment achieved through homeownership can enhance psychological health, happiness and well-being for homeowners and those around them.”
  • Property Maintenance and Improvement: Your home is your stake in the community, and a way to give back by driving value into your neighborhood.
  • Civic Participation: Homeownership creates stability, a sense of community, and increases civic engagement. It’s a way to add to the strength of your local area.

Financial Benefits

Buying a home is also an investment in your family’s financial future.

  • Net Worth: Homeownership builds your family’s net worth. “The median family net worth for all homeowners ($231,400) increased by nearly 15% since 2013, while net worth ($5,000) actually declined by approximately 9% since 2013 for renter families.”
  • Financial Security: Equity, appreciation, and predictable monthly housing expenses are huge financial benefits of homeownership. Homeownership is truly the best way to improve your long-term net worth.

Economic Benefits

Homeownership is even a local economic driver.

  • Housing-Related Spending: An economic force throughout our nation, housing-related expenses accounted for more than one-sixth of the country’s economic activity over the past three decades.
  • GDP Growth: Homeownership also helps drive GDP growth as the country aims to make an economic rebound. “Every 10% increase in total housing market wealth would translate to approximately $147 billion in additional consumer spending, or 0.8% of GDP, as well as billions of dollars in new federal tax revenue.”
  • Entrepreneurship: Homeownership is even a form of forced savings that provides entrepreneurial opportunities as well. “Owning a home enables new entrepreneurs to obtain access to credit to start or expand a business and generate new jobs by using their home as collateral for small business loans.”

Bottom Line

The benefits of homeownership are vast and go well beyond the surface level. Homeownership is truly a way to build financial freedom, find greater satisfaction and happiness, and make a substantial impact on your local economy. If owning a home is part of your dream, let’s connect today so you can begin the homebuying process.

The Pain of Unemployment: It Will Be Deep, But Not for Long

by Christie Cannon

The Pain of Unemployment: It Will Be Deep, But Not for Long

The Pain of Unemployment: It Will Be Deep, But Not for Long | MyKCM
 

There are two crises in this country right now: a health crisis that has forced everyone into their homes and a financial crisis caused by our inability to move around as we normally would. Over 20 million people in the U.S. became instantly unemployed when it was determined that the only way to defeat this horrific virus was to shut down businesses across the nation. One second a person was gainfully employed, a switch was turned, and then the room went dark on their livelihood.

The financial pain so many families are facing right now is deep.

How deep will the pain cut?

Major institutions are forecasting unemployment rates last seen during the Great Depression. Here are a few projections:

  • Goldman Sachs - 15%
  • Merrill Lynch - 10.6%
  • JP Morgan - 8.5%
  • Wells Fargo - 7.3%

How long will the pain last?

As horrific as those numbers are, there is some good news. The pain will be deep, but it won’t last as long as it did after previous crises. Taking the direst projection from Goldman Sachs, we can see that 15% unemployment quickly drops to 6-8% as we head into next year, continues to drop, and then returns to about 4% in 2023.

When we compare that to the length of time it took to get back to work during both the Great Recession (9 years long) and the Great Depression (12 years long), we can see how the current timetable is much more favorable.The Pain of Unemployment: It Will Be Deep, But Not for Long | MyKCM

Bottom Line

It’s devastating to think about how the financial heartache families are going through right now is adding to the uncertainty surrounding their health as well. Hopefully, we will soon have the virus contained and then we will, slowly and safely, return to work.

Homes Are More Affordable Today, Not Less Affordable

by Christie Cannon

Homes Are More Affordable Today, Not Less Affordable

Homes Are More Affordable Today, Not Less Affordable | MyKCM
 

There’s a current narrative that owning a home today is less affordable than it has been in the past. The reason some are making this claim is because house prices have substantially increased over the last several years.

It’s not, however, just the price of a home that matters.

Homes, in most cases, are purchased with a mortgage. The current mortgage rate is a major component of the affordability equation. Mortgage rates have fallen by over a full percentage point since December 2018. Another major piece of the affordability equation is a buyer’s income. The median family income has risen by approximately 3% over the last year.

The National Association of Realtors (NAR) releases a monthly Housing Affordability Index. The latest index shows that home affordability is better today than at almost any point over the last 30 years. The index determines how affordable homes are based on the following:

“A Home Affordability Index value of 100 means that a family with the median income has exactly enough income to qualify for a mortgage on a median-priced home. An index of 120 signifies that a family earning the median income has 20 percent more than the level of income needed pay the mortgage on a median-priced home, assuming a 20 percent down payment so that the monthly payment and interest will not exceed 25 percent of this level of income (qualifying income).”

The higher the index, therefore, the more affordable homes are. Here is a graph showing the index since 1990:Homes Are More Affordable Today, Not Less Affordable | MyKCMObviously, affordability was better during the housing crash when distressed properties – foreclosures and short sales – sold at major discounts (2009-2015). Outside of that period, however, homes are more affordable today than any other year since 1990, except for 2016.

The report on the index also includes a section that calculates the mortgage payment on a median priced home as a percentage of the median national income. Historically, that percentage is just above 21%. Here are the percentages since June of 2018:Homes Are More Affordable Today, Not Less Affordable | MyKCMAgain, we can see that affordability is much better today than the historical average and has been getting better over the last year and a half.

Bottom Line

Whether you’re thinking about buying your first home or moving up to the home of your dreams, don’t let the false narrative about affordability prevent you from moving forward. From an affordability standpoint, this is one of the best times to buy in the last 30 years.

 
Dallas-Fort Worth is again near the top of a shopping list for commercial property investors — behind only Los Angeles in a new survey. For the third year in a row, commercial real estate firm CBRE ranked D-FW second nationally in its survey of property investors. Houston also made the top 10.

Investors said industrial and warehouse buildings and apartments were their most targeted properties for 2019.


"We are seeing unprecedented investor interest for industrial and logistics properties in Dallas-Fort Worth coming not only from U.S. investors but also global capital from Asia, primarily Singapore, Europe, and the Middle East," Randy Baird, CBRE executive vice president of Industrial & Logistics, said in the report. "D-FW is capturing the interest of all forms of capital because we are at a central point in the U.S. supply chain, we have a pro-business environment with a low cost of doing business, and we have nation-leading population growth. 
"Investors are attracted not only by the current market fundamentals, which are stronger than ever but by the long-term view that D-FW and Texas as a whole will continue to outpace the country in population and job growth, translating to long-term asset appreciation.  "Only 1 in 10 of the investors CBRE polled said they planned to acquire office buildings this year. And only 9 percent said they were shopping for retail properties.  While 98 percent of the real estate industry execs CBRE surveyed said they planned to make property acquisitions this year, more investors indicated they would be more cautious in their buys."Pricing is at or near the previous peak for most asset types in prime locations, so investors are seeking yield in secondary markets and alternative asset types," said Chris Ludeman, Global President of Capital Markets for CBRE.  CBRE surveyed investors in November and December for the annual report. 
 After Los Angeles and D-FW, the real estate markets that investors are most hot on are Washington, D.C., San Francisco, Seattle, Denver and Atlanta.  When asked to list their top concerns for the real estate market this year, investors most often mentioned a global economic shock, rising interest rates and a property price bubble.  CBRE's annual investor poll is just the latest industry snapshot in which D-FW won high marks. Last fall, the Urban Land Institute and PriceWaterhouse Coopers identified D-FW as the top market for 2019 real estate investment and development activity.
 

Christie Cannon of The Christie Cannon Team | Keller Williams was blessed with the opportunity to share our APP with the viewer of Good Morning Texas!   For our APP text APP to 469-951-9588

Displaying blog entries 1-7 of 7

Syndication

Categories

Archives

Share This Page

Contact Information

Photo of Christie Cannon Real Estate
Christie Cannon
Keller Williams Realty
5933 Preston Road #300
Frisco TX 75034
972-215-7747
Fax: 972-215-7748
Keller Williams Frisco - The Christie Cannon Team - http://www.christiecannon.com