Real Estate Information Archive

Blog

Displaying blog entries 1-10 of 160

Why You Need a True Expert in Today’s Housing Market

by Christie Cannon

Why You Need a True Expert in Today’s Housing Market


The housing market continues to shift and change, and in a fast-moving landscape like we’re in right now, it’s more important than ever to have a trusted real estate agent on your side. Whether you’re buying your first home or selling once again, it’s mission critical to work with an expert who can guide you through each unique step of the process. 

The reality is, not all agents operate the same way. To truly make a powerful and confident decision as you buy or sell a home, you need a real estate expert who uses their knowledge of what’s really happening with home prices, housing supply, industry projections, and more to give you the best possible advice. Someone who can provide clarity and trust like that is essential to your success. Jay Thompson, Real Estate Industry Consultant, explains:

“Housing market headlines are everywhere. Many are quite sensational, ending with exclamation points or predicting impending doom for the industry. Clickbait, the sensationalizing of headlines and content, has been an issue since the dawn of the internet, and housing news is not immune to it.”

Unfortunately, when information in the media isn’t clear, it can generate a lot of fear and uncertainty for consumers. As Jason Lewris, Co-Founder and Chief Data Officer at Parclsays:

“In the absence of trustworthy, up-to-date information, real estate decisions are increasingly being driven by fear, uncertainty, and doubt.”

But it doesn’t have to be that way. Buying a home is a big decision, and it should be one you feel confident making. You can lean on an expert to help you separate fact from fiction and get the answers you need.

The right agent can assist you in figuring out what’s going on at the national level and in your local area. They can debunk headlines using data you can trust. Experts have in-depth knowledge of the industry and can provide context, so you know how current trends compare to the normal ebbs and flows in the housing market, historical data, and more.

Then, to make sure you have the full picture, an agent can tell you if your local area is following the national trend or if they’re seeing something different in your market. Together, you can use all that information to make the best possible decision.

After all, making a move is a potentially life-changing milestone. It should be something you feel ready for and excited about. And that’s where a trusted expert comes in.

Bottom Line

If you want sound advice and trusted information about our local housing market, let’s connect.

Why Median Home Sales Price Is Confusing Right Now

by Christie Cannon

Why Median Home Sales Price Is Confusing Right Now


The National Association of Realtors (NAR) is set to release its most recent Existing Home Sales (EHS) report tomorrow. This monthly release provides information on the volume of sales and price trends for homes that have previously been owned. In the upcoming release, it’ll likely say home prices are down. This may seem a bit confusing, especially if you’ve been following along and reading the blogs saying home prices have hit the bottom and have since rebounded.

So, why would this say home prices are falling when so many other price reports say they’re going back up? It all depends on the methodology of each one. NAR reports on the median home sales price, while some other sources use repeat sales prices. Here’s how those approaches differ.

The Center for Real Estate Studies at Wichita State University explains median sales prices like this:

The median sale price measures the ‘middle’ price of homes that sold, meaning that half of the homes sold for a higher price and half sold for less . . . For example, if more lower-priced homes have sold recently, the median sale price would decline (because the “middle” home is now a lower-priced home), even if the value of each individual home is rising.”

Investopedia helps define what a repeat sales approach means:

Repeat-sales methods calculate changes in home prices based on sales of the same property, thereby avoiding the problem of trying to account for price differences in homes with varying characteristics.”

The Challenge with the Median Home Sales Price Today

As the quotes above say, the approaches can tell different stories. That’s why median home sales price data (like EHS) may say prices are down, even though the vast majority of the repeat sales reports show prices are appreciating again.

Why Median Home Sales Price Is Confusing Right Now

by Christie Cannon

Why Median Home Sales Price Is Confusing Right Now


The National Association of Realtors (NAR) is set to release its most recent Existing Home Sales (EHS) report tomorrow. This monthly release provides information on the volume of sales and price trends for homes that have previously been owned. In the upcoming release, it’ll likely say home prices are down. This may seem a bit confusing, especially if you’ve been following along and reading the blogs saying home prices have hit the bottom and have since rebounded.

So, why would this say home prices are falling when so many other price reports say they’re going back up? It all depends on the methodology of each one. NAR reports on the median home sales price, while some other sources use repeat sales prices. Here’s how those approaches differ.

The Center for Real Estate Studies at Wichita State University explains median sales prices like this:

The median sale price measures the ‘middle’ price of homes that sold, meaning that half of the homes sold for a higher price and half sold for less . . . For example, if more lower-priced homes have sold recently, the median sale price would decline (because the “middle” home is now a lower-priced home), even if the value of each individual home is rising.”

Investopedia helps define what a repeat sales approach means:

Repeat-sales methods calculate changes in home prices based on sales of the same property, thereby avoiding the problem of trying to account for price differences in homes with varying characteristics.”

The Challenge with the Median Home Sales Price Today

As the quotes above say, the approaches can tell different stories. That’s why median home sales price data (like EHS) may say prices are down, even though the vast majority of the repeat sales reports show prices are appreciating again.

Homebuyers Are Still More Active Than Usual

by Christie Cannon

Homebuyers Are Still More Active Than Usual


Even though the housing market is no longer experiencing the frenzy that was so characteristic of the last couple of years, it doesn’t mean today’s market is at a standstill. In actuality, buyer traffic is still strong today.

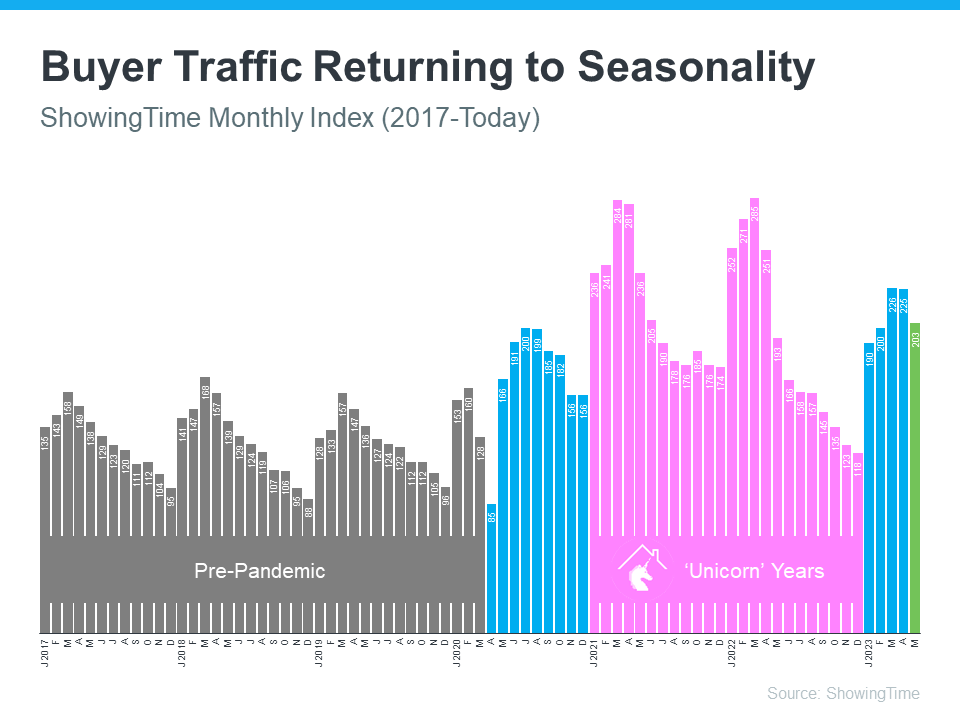
The ShowingTime Showing Index is a measure of how much buyers are touring homes. The graph below uses that index to illustrate buyer activity trends over time to help put today into the proper perspective.

It shows there’s seasonality in real estate. If you look at the last normal years in the market (shown in gray), there was a consistent pattern as buyer activity peaked in the first half of each year (during the peak homebuying season in the spring) and slowed as each year came to a close.

When the pandemic hit in March of 2020, that trend was disrupted as the market responded to the resulting uncertainty (shown in blue in the middle). From there, we entered the ‘unicorn’ years of housing (shown in pink). This is when mortgage rates were record-low and buyer demand was sky high. Similar seasonal trends still existed even during that time, just at much higher levels.

Now, let’s look at 2023. Traffic is down from the previous month and it’s also lower than the peaks we saw in the ‘unicorn’ years. But what’s happening isn’t a steep drop off in demand – it’s a slow return toward more normal seasonality. As the ShowingTime report explains:

“Showing traffic declined about 10% in May . . . This follows a typical seasonal pattern – disrupted by the pandemic but now beginning to return . . .”

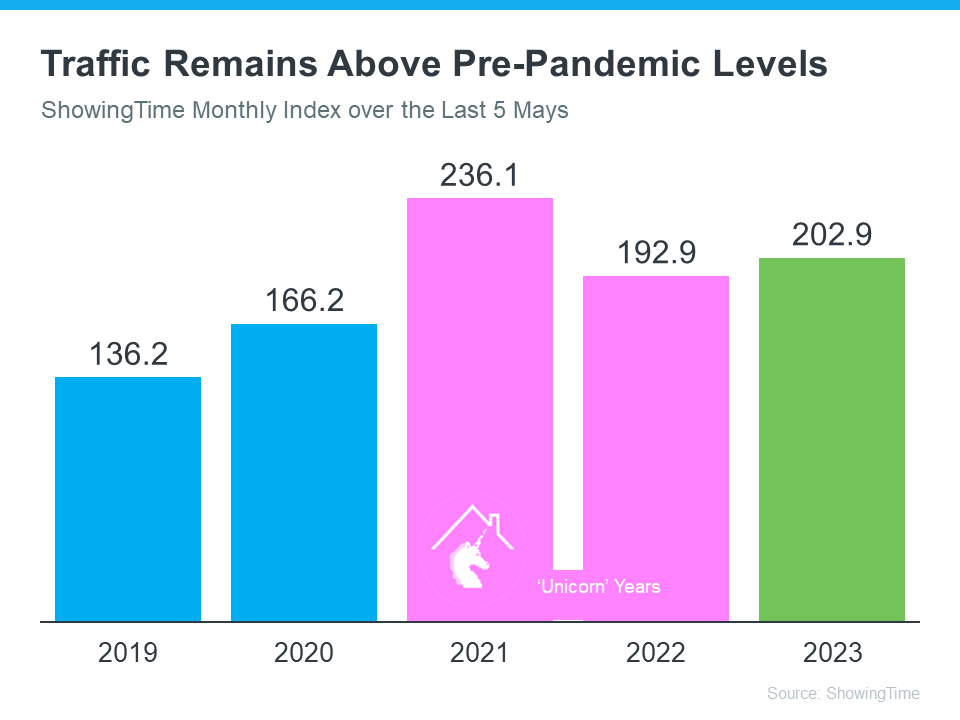
And, to highlight this isn’t a drastic decline, let’s zoom in. Here’s a graph using just the May data for the last five years. It shows just how strong buyer demand still is.

What Does That Mean for You?

Buyers are still out there touring homes. They’re more active than they were in May 2022 (when sticker shock over higher mortgage rates started to set in) and certainly more than they were in the last normal years. So, remember, buyer activity is still strong. And it could actually be even stronger if it wasn’t constrained by the limited supply of homes for sale. According to U.S. News:

“Housing markets have cooled slightly, but demand hasn’t disappeared, and in many places remains strong largely due to the shortage of homes on the market.”

Bottom Line

Don’t lose sight of just how active the market still is today. If your house isn’t on the market, it’s not getting in front of all those buyers who are looking to make a purchase right now. Let’s connect to start the process.

Explaining Today’s Mortgage Rates

by Christie Cannon

Explaining Today’s Mortgage Rates


If you’re following mortgage rates because you know they impact your borrowing costs, you may be wondering what the future holds for them. Unfortunately, there’s no easy way to answer that question because mortgage rates are notoriously hard to forecast.  

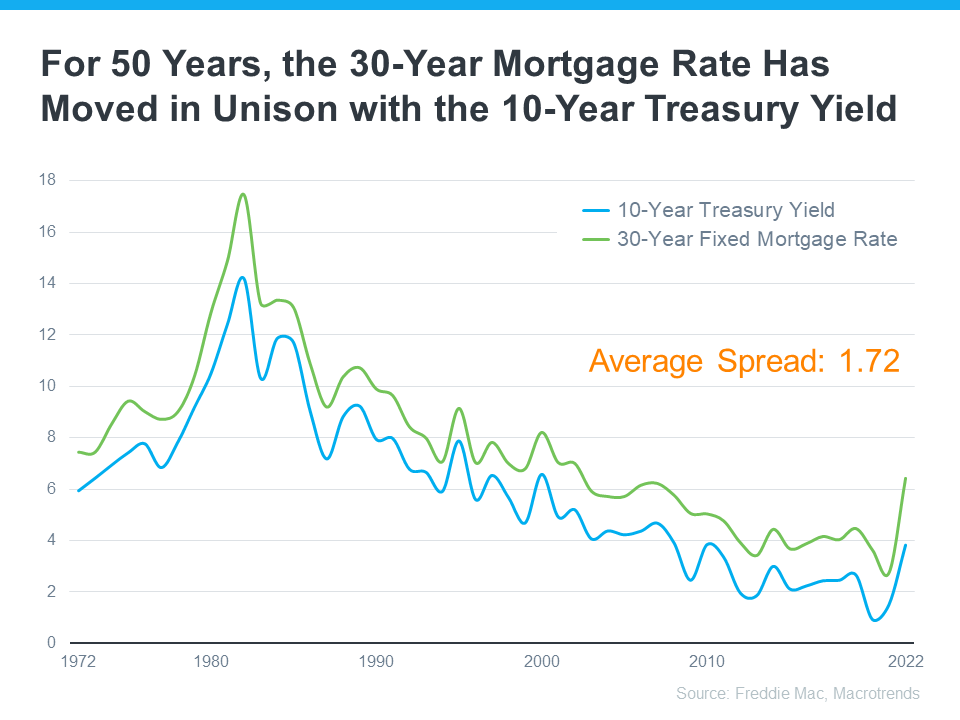
But, there’s one thing that’s historically a good indicator of what’ll happen with rates, and that’s the relationship between the 30-Year Mortgage Rate and the 10-Year Treasury Yield. Here’s a graph showing those two metrics since Freddie Mac started keeping mortgage rate records in 1972:

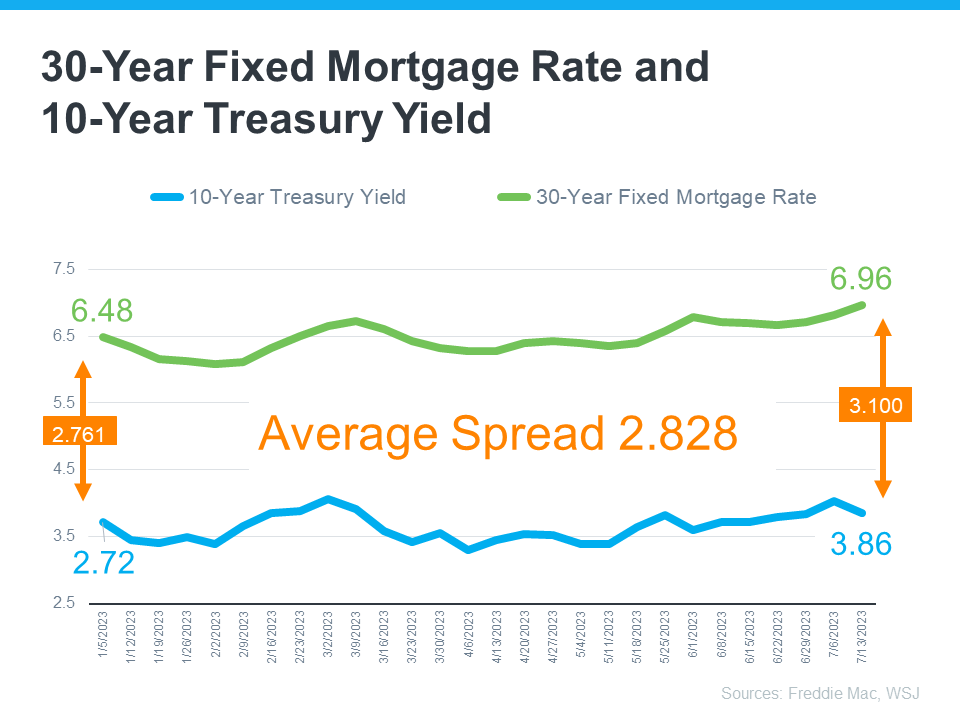
As the graph shows, historically, the average spread between the two over the last 50 years was 1.72 percentage points (also commonly referred to as 172 basis points). If you look at the trend line you can see when the Treasury Yield trends up, mortgage rates will usually respond. And, when the Yield drops, mortgage rates tend to follow. While they typically move in sync like this, the gap between the two has remained about 1.72 percentage points for quite some time. But, what’s crucial to notice is that spread is widening far beyond the norm lately (see graph below):

If you’re asking yourself: what’s pushing the spread beyond its typical average? It’s primarily because of uncertainty in the financial markets. Factors such as inflation, other economic drivers, and the policy and decisions from the Federal Reserve (The Fed) are all influencing mortgage rates and a widening spread.

Why Does This Matter for You?

This may feel overly technical and granular, but here’s why homebuyers like you should understand the spread. It means, based on the normal historical gap between the two, there’s room for mortgage rates to improve today.

Explaining Today’s Mortgage Rates

by Christie Cannon

Explaining Today’s Mortgage Rates


If you’re following mortgage rates because you know they impact your borrowing costs, you may be wondering what the future holds for them. Unfortunately, there’s no easy way to answer that question because mortgage rates are notoriously hard to forecast.  

But, there’s one thing that’s historically a good indicator of what’ll happen with rates, and that’s the relationship between the 30-Year Mortgage Rate and the 10-Year Treasury Yield. Here’s a graph showing those two metrics since Freddie Mac started keeping mortgage rate records in 1972:

As the graph shows, historically, the average spread between the two over the last 50 years was 1.72 percentage points (also commonly referred to as 172 basis points). If you look at the trend line you can see when the Treasury Yield trends up, mortgage rates will usually respond. And, when the Yield drops, mortgage rates tend to follow. While they typically move in sync like this, the gap between the two has remained about 1.72 percentage points for quite some time. But, what’s crucial to notice is that spread is widening far beyond the norm lately (see graph below):

If you’re asking yourself: what’s pushing the spread beyond its typical average? It’s primarily because of uncertainty in the financial markets. Factors such as inflation, other economic drivers, and the policy and decisions from the Federal Reserve (The Fed) are all influencing mortgage rates and a widening spread.

Why Does This Matter for You?

This may feel overly technical and granular, but here’s why homebuyers like you should understand the spread. It means, based on the normal historical gap between the two, there’s room for mortgage rates to improve today.

Home Prices Are Rebounding

by Christie Cannon

Home Prices Are Rebounding


If you’re following the news today, you may feel a bit unsure about what’s happening with home prices and fear whether or not the worst is yet to come. That’s because today’s headlines are painting an unnecessarily negative picture. If we take a year-over-year view, home prices did drop some, but that’s because we’re comparing to a ‘unicorn’ year when prices peaked well beyond the norm.

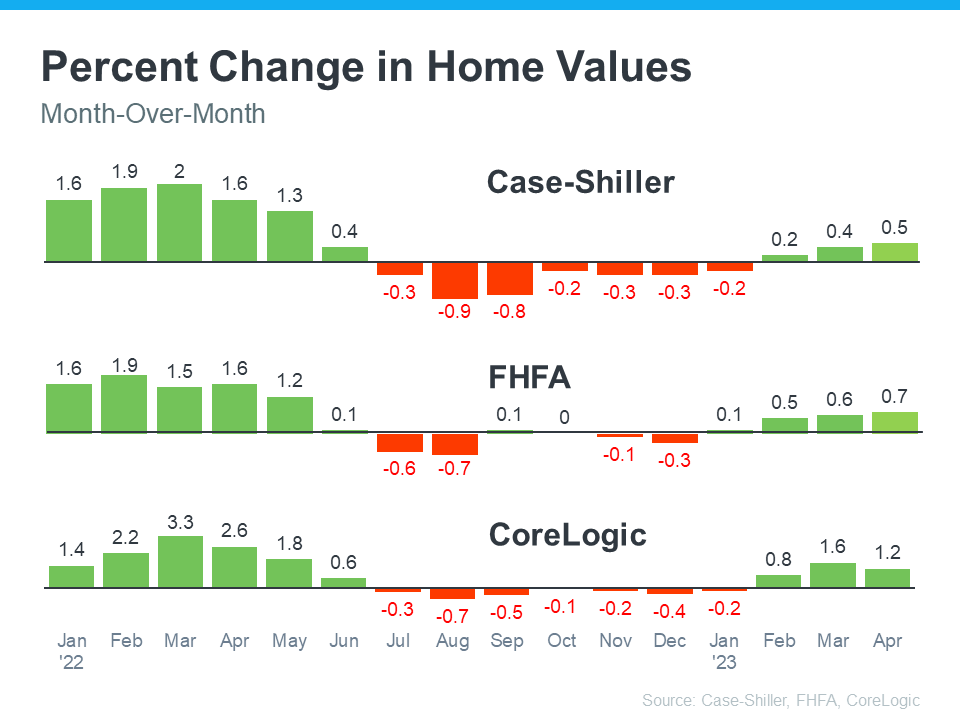
To avoid an unfair comparison to that previous peak, we need to look at monthly data. And that tells a very different and much more positive story. While local home price trends still vary by market, here’s what the national data tells us.

The graphs below use recent monthly reports from three sources to show the worst home price declines are already behind us, and prices are appreciating nationally.


Looking at this monthly view, we can see the past year in the housing market can be divided into two parts. In the first half of 2022, home prices were going up, and fast. However, starting in July, prices began to go down (

Today’s Housing Inventory Is a Sweet Spot for Sellers

by Christie Cannon

Today’s Housing Inventory Is a Sweet Spot for Sellers


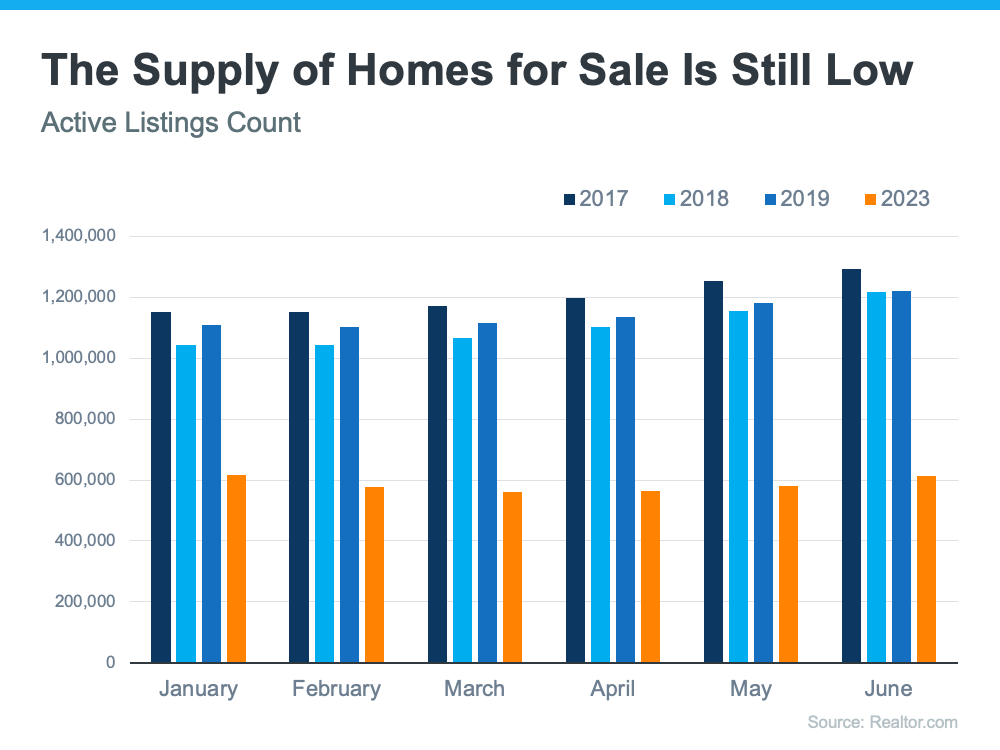
One of the biggest challenges in the housing market right now is how few homes there are for sale compared to the number of people who want to buy them. To help emphasize just how limited housing inventory still is, let’s take a look at the latest information on active listings, or homes for sale in a given month, as it compares to more normal levels.

According to a recent report from Realtor.com

 “On average, active inventory in June was 50.6% below pre-pandemic 2017–2019 levels.”

The graph below helps illustrate this point. It uses historical data to provide a more concrete look at how much the numbers are still lagging behind the level of inventory typical of a more normal market (see graph below):

It’s worth noting that 2020-2022 are not included in this graph. That’s because they were truly abnormal years for the housing market. To make the comparison fair, those have been omitted so they don’t distort the data.

When you compare the orange bars for 2023 with the last normal years for the housing market (2017-2019), you can see the count of active listings is still far below the norm.

What Does This Mean for You? 

If you’re thinking about selling your house, that low inventory is why this is a great time to do so. Buyers have fewer choices now than they did in more normal years, and that’s continuing to impact some key statistics in the housing market. For example, sellers will be happy to see the following data from the latest Confidence Index from the National Association of Realtors (NAR):

  • The percent of homes that sold in less than a month ticked up slightly to 74%. 
  • The median days on market went down to 18 days, showing homes are still selling fast when priced right. 
  • The average number of offers on recently sold homes went up to 3.3 offers.

Bottom Line

When supply is so low, your house is going to be in the spotlight. That’s why sellers are seeing their homes sell a little faster and get more offers right now. If you’ve thought about selling, now’s the time to make a move. Let’s connect to get the process started.

Where Will You Go If You Sell? Newly Built Homes Might Be the Answer.


Do you want to sell your house, but hesitate because you’re worried you won’t be able to find your next home in today’s market? You're not alone, but there’s some good news that may ease your worries. New home construction is up and is becoming an increasingly significant part of the housing inventory.

That means when you go to put your house on the market this summer, considering newly built homes is crucial for expanding the options you’ll have for your next move.

Near-Record Percentage of New Home Inventory

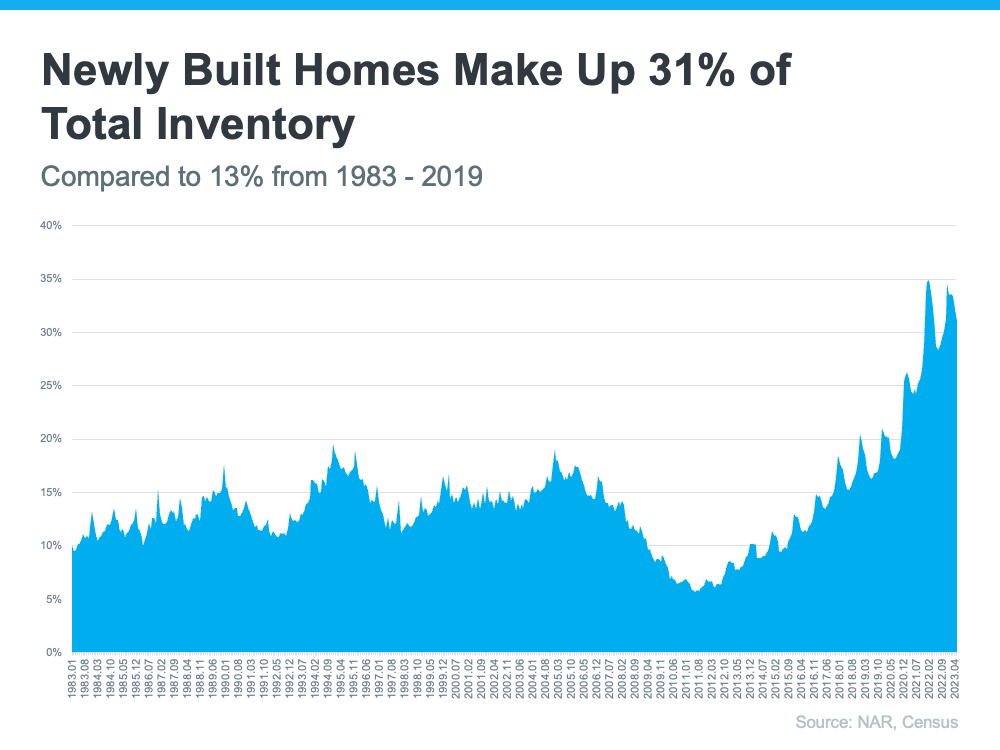
Newly built homes today make up a near-record percentage of the total number of homes available for sale (see graph below):

In fact, as the data shows, newly built homes now make up 31% of the total for-sale inventory. Over the past couple of decades, newly built homes made up an average of only around 13% of total housing inventory from 1983 to 2019.

That means the percentage of the total available homes that are newly built is over two times higher than the norm.

Why This Matters to You 

Overall, the supply of homes for sale is still low. And when there’s limited supply, it’s crucial to explore all of your available choices. New-home construction has emerged as a game changer with increasing inventory. Not to mention, recent data shows it’s gaining even more momentum as more newly built homes are underway and will be coming to the market in the months ahead.

Robert Dietz, Chief Economist at the National Association of Home Builders (NAHB), highlights the importance of newly built homes for those looking to buy in today’s housing market. Dietz states:

"With limited available housing inventory, new construction will continue to be a significant part of prospective buyers' search in the quarters ahead."

Don’t overlook this growing market segment and risk missing out on great opportunities to find your ideal home. Since new home construction accounts for roughly 31% of total for sale inventory, you could be cutting nearly one in three options from your search if you don’t consider newly built homes. 

If you’re looking to make a move, a local real estate agent can help you sell your current house and explore newly built options in your area. They have the expertise you need to handle both sides of the process so you can move out of your current house and into your brand-new dream home.

Bottom Line

Now’s the time to sell your house and take advantage of the momentum that’s building in new home construction. Let’s connect so you have a guide throughout the selling and buying process. Together, we can make your transition to a newly built home a reality.

This Real Estate Market Is the Strongest of Our Lifetime

by Christie Cannon

This Real Estate Market Is the Strongest of Our Lifetime


When you look at the numbers today, the one thing that stands out is the strength of this housing market. We can see this is one of the most foundationally strong housing markets of our lifetime – if not the strongest housing market of our lifetime. Here are two fundamentals that prove this point. 

1. The Current Mortgage Rate on Existing Mortgages

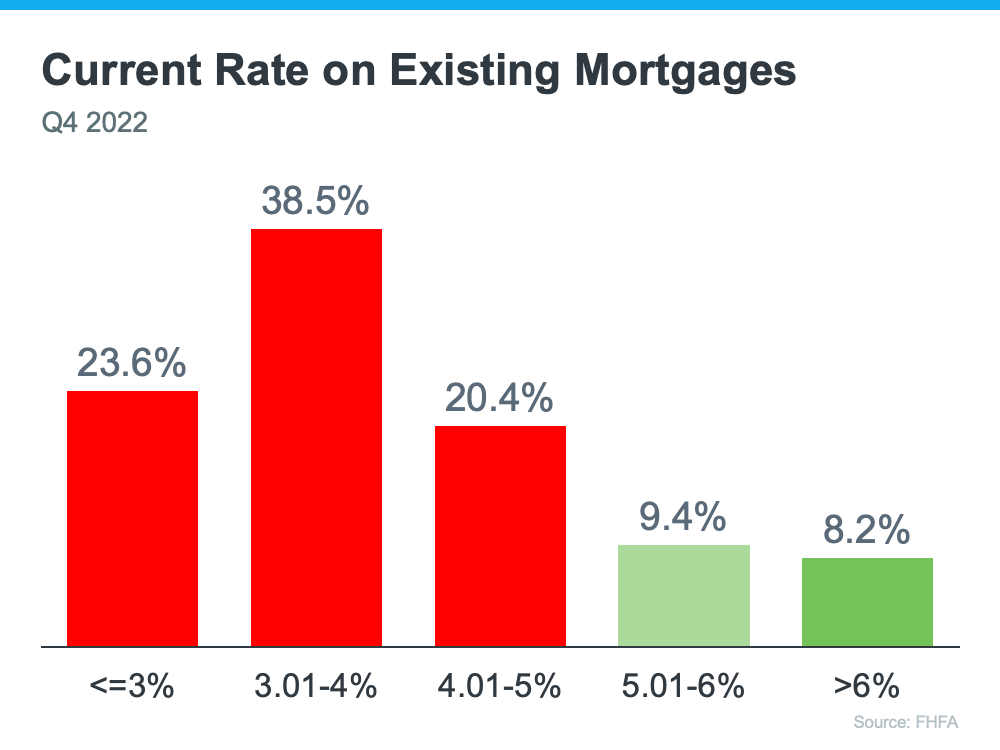
First, let’s look at the current rate on existing mortgages. According to the Federal Housing Finance Agency (FHFA), as of the fourth quarter of last year, over 80% of existing mortgages have a rate below 5%. That’s significant. And, to take that one step further, over 50% of mortgages have a rate below 4% (see graph below):

Now, there’s a lot of talk in the media about a potential foreclosure crisis or a rise of homeowners defaulting on their loans, but consider this. Homeowners with such good mortgage rates are going to work as hard as they can to keep that mortgage and stay in their homes. That’s because they can't go out and buy another house, or even rent an apartment, and pay what they do today. Their current mortgage payment is more affordable. Even if they downsize, with today’s higher mortgage rates, it could cost more.

Here's why this gives the housing market such a solid foundation today. Having so many homeowners with such low mortgage rates helps us avoid a crisis with a flood of foreclosures coming to market like there was back in 2008.

2. The Amount of Homeowner Equity

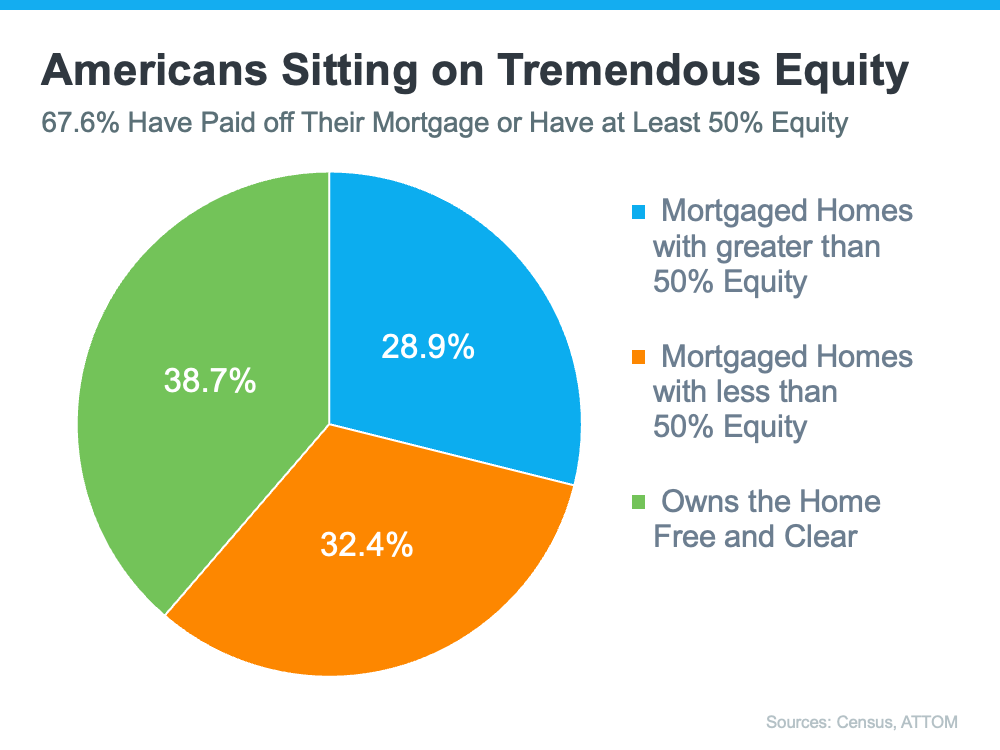
Second, Americans are sitting on tremendous equity right now. According to the Census and ATTOM, roughly two-thirds (around 68%) of homeowners have either paid off their mortgage or have at least 50% equity (see chart below):

In the industry, the term for this is equity rich. This is significant because if you think back to 2008, some people had to make the difficult decision to walk away from their homes because they owed more on the home than it was worth.

But this time, things are different because homeowners have built up so much equity over the past few years alone. And, when homeowners have that much equity, it helps us avoid another wave of distressed properties coming onto the market like we saw during the crash. It also creates an extremely strong foundation for today’s housing market.

Bottom Line

We are in one of the most foundationally strong housing markets of our lifetime because homeowners are going to fight to keep their current mortgage rate and they have a tremendous amount of equity. This is yet another reason things are fundamentally different than in 2008.


Displaying blog entries 1-10 of 160

Syndication

Categories

Archives

Share This Page

Contact Information

Photo of Christie Cannon Real Estate
Christie Cannon
Keller Williams Realty
5933 Preston Road #300
Frisco TX 75034
972-215-7747
Fax: 972-215-7748
Keller Williams Frisco - The Christie Cannon Team - http://www.christiecannon.com