Explaining Today’s Mortgage Rates
Explaining Today’s Mortgage Rates

If you’re following mortgage rates because you know they impact your borrowing costs, you may be wondering what the future holds for them. Unfortunately, there’s no easy way to answer that question because mortgage rates are notoriously hard to forecast.
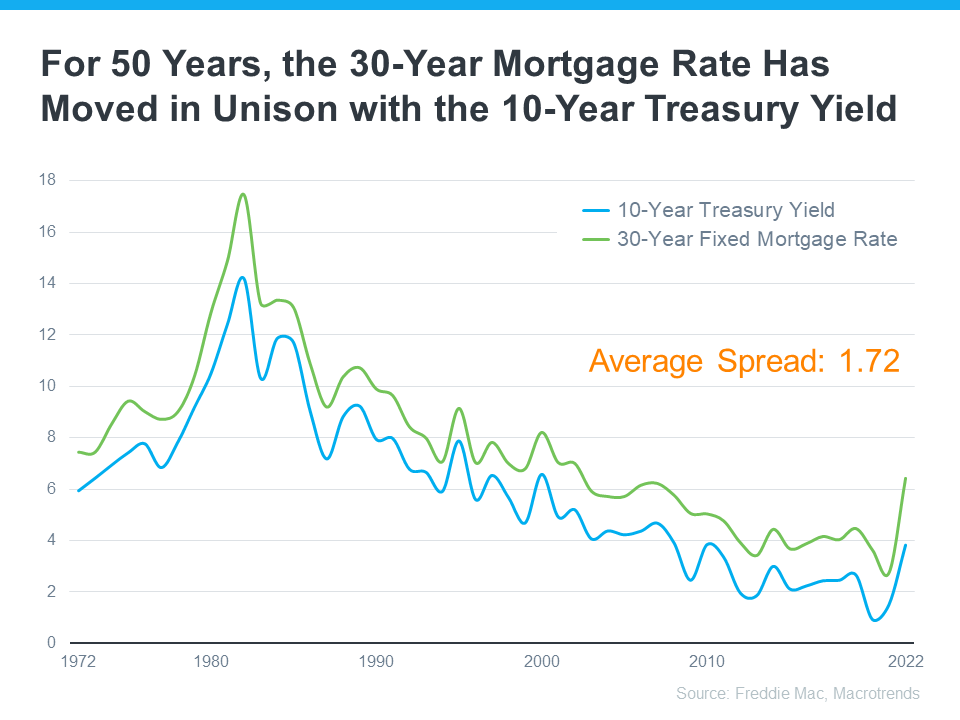
But, there’s one thing that’s historically a good indicator of what’ll happen with rates, and that’s the relationship between the 30-Year Mortgage Rate and the 10-Year Treasury Yield. Here’s a graph showing those two metrics since Freddie Mac started keeping mortgage rate records in 1972:
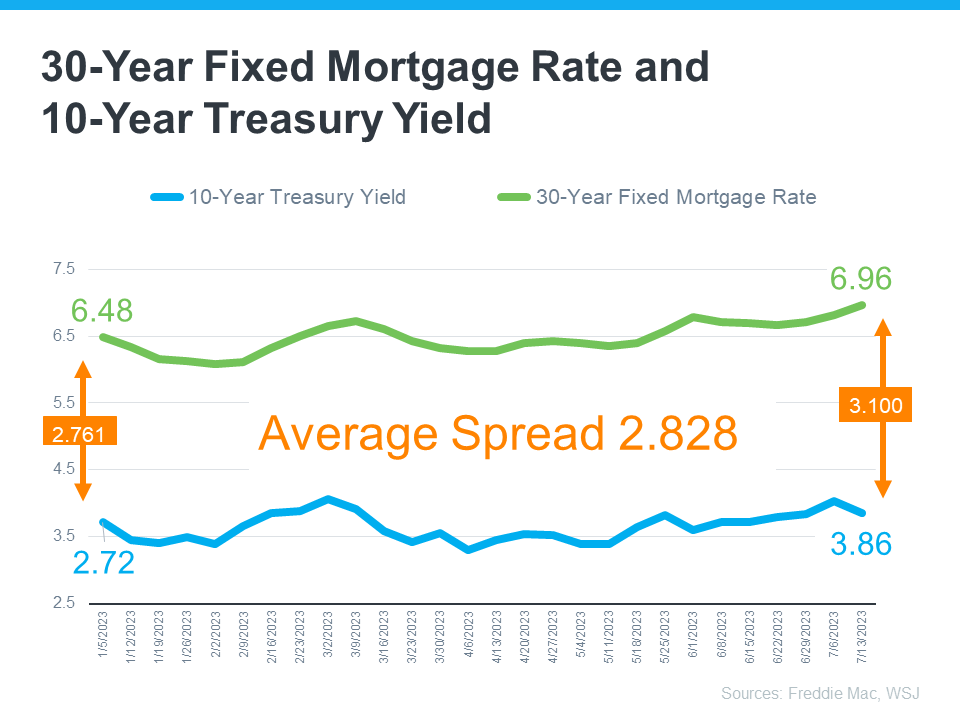
As the graph shows, historically, the average spread between the two over the last 50 years was 1.72 percentage points (also commonly referred to as 172 basis points). If you look at the trend line you can see when the Treasury Yield trends up, mortgage rates will usually respond. And, when the Yield drops, mortgage rates tend to follow. While they typically move in sync like this, the gap between the two has remained about 1.72 percentage points for quite some time. But, what’s crucial to notice is that spread is widening far beyond the norm lately (see graph below):
If you’re asking yourself: what’s pushing the spread beyond its typical average? It’s primarily because of uncertainty in the financial markets. Factors such as inflation, other economic drivers, and the policy and decisions from the Federal Reserve (The Fed) are all influencing mortgage rates and a widening spread.
Why Does This Matter for You?
This may feel overly technical and granular, but here’s why homebuyers like you should understand the spread. It means, based on the normal historical gap between the two, there’s room for mortgage rates to improve today.


